Is it possible to show just a colored point from a scalar result at each gauss point,
instead of drawing contour, extrapolation etc ?
I have a result flag (e.g. cracking) at a concrete element and just want to display that
flag (either by a colored point or a label) on the gauss point itself. It seems easy but I
have not found any way to do it. Thanks !
You can set the ‘Display style’ to Points, or ‘Points bound’
then instead to see the elements filled or other kind of visualization the result is represented drawing a point on each gauss point.
You can also have somo control about how this ‘point’ is drawn in
Utilities->Preferences… Postprocess->Mesh elements
in ‘Point element options’ could set the ‘point size’ and quality, and a ‘quality factor’. Each point could be represented as a dot, or as a sphere drawn from ‘a photo’ or as a polygon with more or less detail approximating a sphere.
You can also attach the zip of the model with the result, to test it with the specific type of element, amount and location of gauss point results, etc.
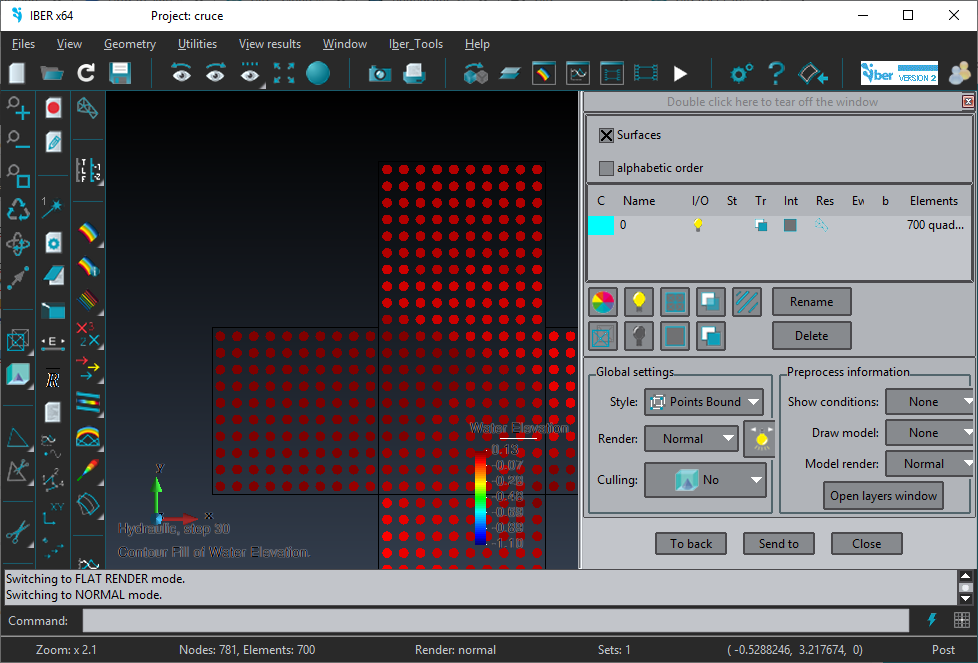
This is an example of a mesh of quadrilaterals with 1 gauss point, with a scalar result represented with ‘Display stype’=‘Points bound’
Thanks a million for the detailed info !
It works fine, and you can overlay those points on the model geometry as well which is very convenient.
The only issue I have found is that the max and min values in the legend are calculated from the node-extrapolated
results and not by the gauss points results ! So they show very different values compared to the actual ones.
… and generally the legend adjusts the max and min according to all available results instead of the visible results only.
This is extra work because you have to change min and max every time by hand.
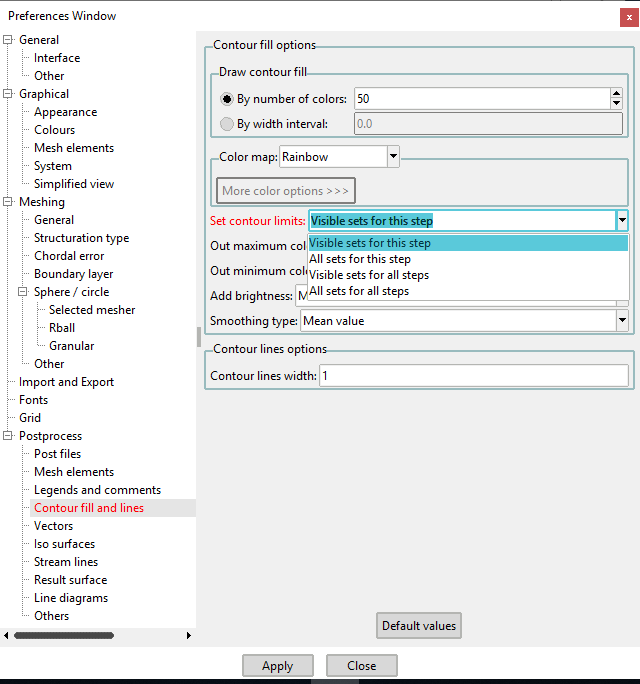
My bad, I had to select ‘visible sets for this step’ in options… now everything is perfect.
Thanks once more !
… except that max/min is calculated using extrapolated results on nodes when only gauss points are shown. But this can be fixed by user range.
about
the legend adjusts the max and min according to all available results instead of the visible results only.
There is a GiD variable to control this behavior, in Utilities->Preferences…
This works fine, but it takes max and min from node-extrapolated results as well, right ?
Actually something really strange happens : results show correctly only for the very first time I open the preprocessor, and max/min values appear in a square box. The second time and after that, the square disappears and wrong max/min is shown in the legend…