Hi GID Team,
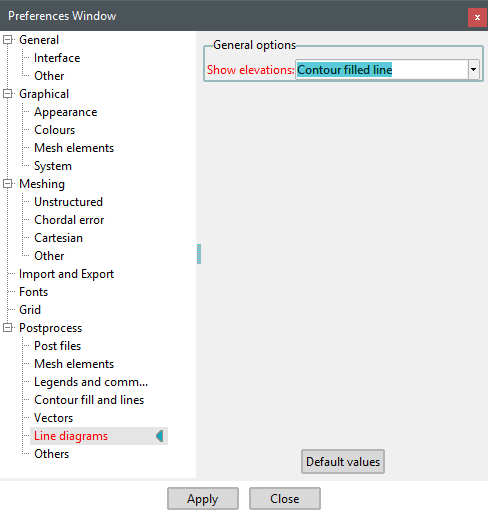
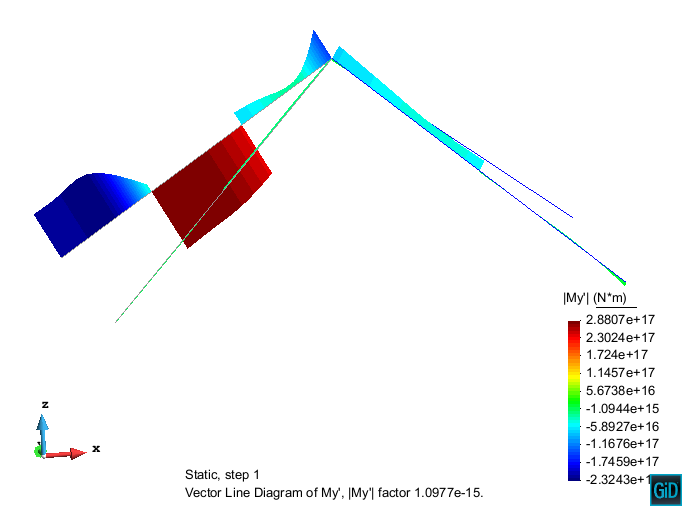
in my case I can’t properly visualize my post processor results. I want to create a scalar line diagram for axial forces and beam moments in a 3D-analysis. I expected that I would see the distribution of the variety of results in colors but I can only see the distribution by shape. Every is shown in orange planes.
I use GID 13.0.1 with the module Xplore.
Thanks for your consideration
Marcel