I have a problem of material discontinuity in solid mechanics of composites.
I’ve solved the problem separating the domain of each material, and I have 2 sub-problems joined because of the discontinuity interface between materials. In every point belonging to the interface, I have 2 results, one for each material.
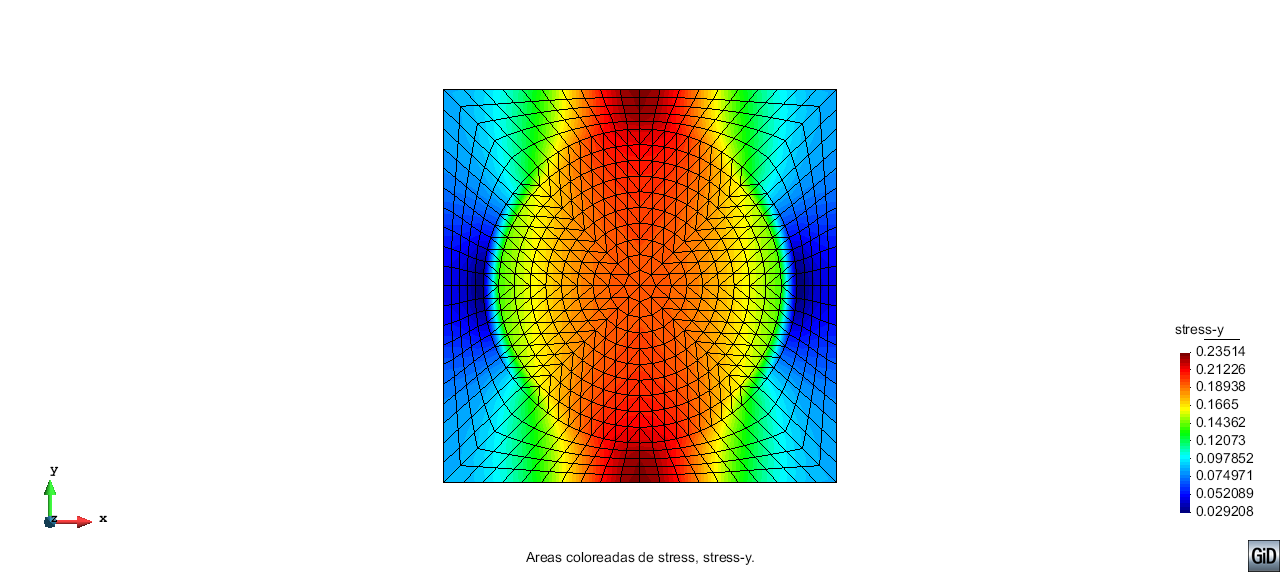
The problem is, when I have to plot, every node has an ID and a result associated, so until now, I only give one of two results, and in consequence the program smooths the result in discontinuity lines, when discontinuity is like a step function.
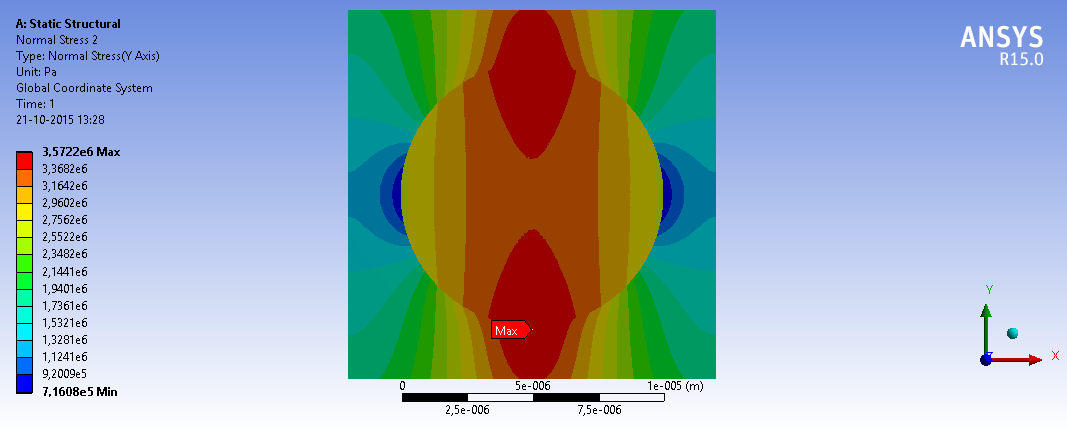
I’ve attached 2 images, one is the result I got plotting as usual in GID. The second is a result from ansys that shows the abrupt change that I want. The problem is circular fiber inside a square representative volume.
So if I could put two results in the same point… it would be nice, but it is possible?
I have my problem solver. The solution is to descolapse both surface, so the line of discontinuity is double. Then, there is a node for each domain. When the problem is solved, the program can plot the two material correctly.
I just came across the same problem. Can you please share a sample or explain more. for each material I can define its own submesh
defined in post.msh file. I also get for each submesh a solution value for each node. How does the post.res file look like? Gid should not
so smoothing across material interfaces.
Thanks
you must not define two values of a result for the same node,
you mus simply have two different nodes, each one with its unique number (they could be in the same x,y,z location)